

© 2013. AP Photo/Matt Sedensky
Introductionꜛ
In the United States, the population aged 65 years and older is growing rapidly. In 2010, these older Americans comprised 13 percent of the U.S. population. Population projections for 2030 show a marked increase, with older adults comprising 19 percent of the population or an estimated 72 million older adults.1 Furthermore, the number of older people choosing to remain on the job has been ticking upward since the late 1990s, and they now represent the fastest-growing segment in the country’s workforce. By 2020, an estimated one-fourth of American workers will be 55 or older, up from 19 percent in 2010.2 For both men and women, the rate of older Americans working longer has been increasing steadily since the 1990s.
Older Americans are not only growing rapidly in numbers but are also becoming substantially healthier. The duration of health old age is increasing,3 due in part to increases in life span and to shorter and later periods of illness. Faced with the expectation of living healthier for longer, older adults may opt to remain in the workforce for longer and defer savings, and Social Security for a later age.4 Increased workforce participation of older adults has implications for retirement policy, Social Security5 and health care financing, and the behavior of employers and employees alike.
With funding from the Sloan Foundation, the Associated Press-NORC Center for Public Affairs Research conducted a national survey of 1,024 adults ages 50 and over. This survey illuminates a slow-moving shift in the American idea of retirement. Retirement is not only coming later in life, but for many it no longer represents a complete exit from the workforce. The key findings from the study, summarized below, provide much-needed information on the implications for individuals and the economy of this growing trend toward working later in life. This survey gives a voice to older Americans and contributes to an in-depth public discourse on the issue.
- The line between working and retirement is shifting for Americans ages 50 and older, with many currently or expecting to continue working for pay during retirement. Among those who are working and not yet retired, 47 percent say it is very likely that they will do some work for pay during their retirement and another 35 percent say it is somewhat likely. Both financial and nonfinancial factors are associated with expectations of working during retirement.
- Twenty-two percent of adults age 50 years and older have searched for a job in the last five years. Of these adults age 50 years and older who have searched for a job in the last five years, 55 percent found the job search to be moderately or very difficult.
- The average retirement age has shifted since the beginning of the Great Recession. Among those who report retiring before the Great Recession, the retirement average age was 57, while the average for those who retired afterwards is 62.
- Among those who are retired, a third (33 percent) report that they did not feel they had a choice except to retire. Feeling like retirement was not by choice is more common among younger retirees, with 54 percent of retirees under age 65 feeling they had no choice but to retire compared with 23 percent of retirees 65 or over.
- Overall, 20 percent of people 50 or older say they have personally experienced prejudice or discrimination because of their age in the job market or at work since turning 50, including being passed over for a raise, promotion, or chance to get ahead; receiving certain unwanted assignments; or being denied access to training or the opportunity to acquire new skills because of their age.
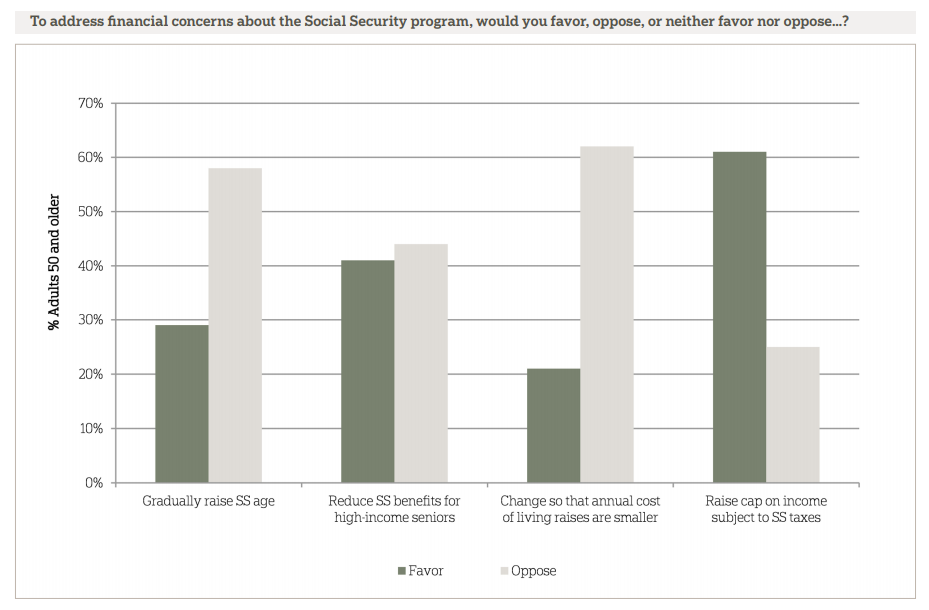
- Americans 50 and older generally agree with the status quo Social Security eligibility age. When asked about ways to address financial concerns with the Social Security program, 61 percent favor raising the cap on income subject to Social Security taxes, 41 percent favor reducing Social Security benefits for seniors with higher incomes, 29 percent favor gradually raising the age at which people can begin receiving benefits, and 21 percent favor changing the way Social Security benefits are calculated so that annual cost of living raises are smaller.
The Line Between Working and Retirement is Shifting for Many Americans Ages 50 and Older, with Some Currently or Expecting to Continue Working for Pay During Retirement.ꜛ
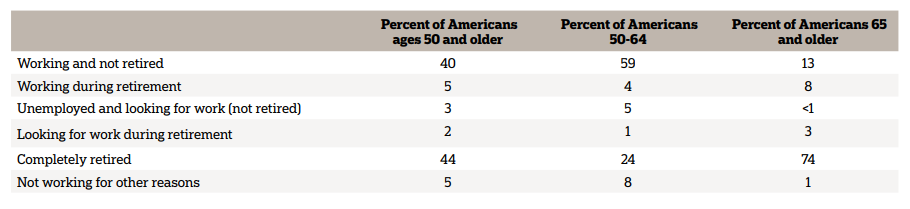
Overall, half of Americans ages 50 and older are working in some capacity or looking for work. Even among those 65 or over, 13 percent are working and not yet retired, 8 percent are working in retirement, and 3 percent are looking for work.
Among those who are working and not yet retired, 47 percent say it is very or extremely likely that they will do some work for pay during their retirement and another 35 percent say it is somewhat likely. Only 10 percent say it is not too likely and only 7 percent say it is not at all likely that they will do work for pay during retirement. Half of Americans 50 and older report that most or almost all of their friends and family members who are around their age are still working.
The likelihood of expecting to work during retirement is associated with factors related to financing retirement. For example, half of respondents who feel secure in their retirement savings say they are unlikely to work after retirement compared with 30 percent of those who feel anxious about their retirement savings. Among individuals who report that financial need is not an important factor in their decision on when to retire, 58 percent say it is unlikely they will work after retirement compared with 28 percent of those who do consider financial need a factor in their retirement decision. Similarly, 46 percent of individuals who say that employer-sponsored benefits are not an important factor in their decision on when to retire report that they are unlikely to work during retirement, compared with 29 percent for whom employer benefits are an important factor in their retirement decision.
Additionally, some nonfinancial factors are associated with expectations to work during retirement, with those basing their retirement decision on their health or ability to do their jobs more likely to expect to continue working during retirement. More individuals who say their health is an important factor in their decision about when to retire expect to work during retirement than do those who do not consider their health an important factor (38 percent vs. 15 percent). Similarly, those who consider their ability to do their jobs an important factor in their decision about when to retire expect to work during retirement more often than those who do not (38 percent vs. 19 percent).
Among those who are retired, a third (33 percent) report that they did not feel they had a choice except to retire. This percentage is lower among the group that is retired but working again (18 percent). Feeling like retirement was not by choice is more common among younger retirees and those with lower incomes in retirement. Fifty-seven percent of retirees under age 65 report feeling they had no choice to retire compared with 23 percent of retirees 65 or over.
In general, Americans aged 50 and over who are working are happy in their jobs. Nine out of 10 of those who are working and not yet retired report that they are somewhat or very satisfied with their jobs. This is consistent with national data across all age groups; 88 percent reported being satisfied with their jobs in the 2012 General Social Survey. Nearly half (47 percent) of those who are not yet retired say that their pay has increased over the last five years, while 36 percent say it has stayed about the same and 16 percent say it has decreased.
Retirement Ages Have Increased Since the Beginning of the Great Recession.ꜛ
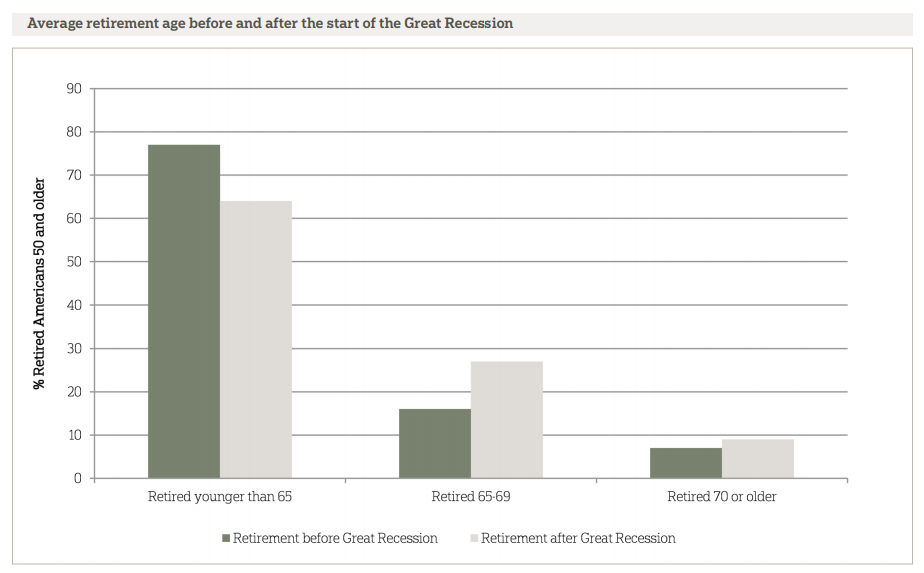
Looking at the time periods before and after the start of the Great Recession (December 2007) shows an increase in the average age at retirement, continuing a trend toward working longer that started in the early nineties. Among those who report retiring before the Great Recession, the average reported retirement age is 57, while the average for those who retired afterwards is 62. Looking only at the five year period leading up to the Great Recession, the average retirement age was 59. More than three-quarters of those who retired before the Great Recession started did so before age 65 (77 percent), with 16 percent retiring between 65 and 69 and 7 percent retiring at age 70 or older. Of those who retired after the recession started, 64 percent retired before age 65, 27 percent retired between age 65 and 69, and 9 percent retired at age 70 or older.
This trend of later retirement ages also means that increasing numbers of Americans have been working later in life than they expected to. Twenty-eight percent of those who retired before the Great Recession say that they retired at a later age than they expected they would at age 40. This is true for 34 percent of those who retired afterwards. The average number of additional years worked for both groups is approximately four and a half years.
Age is Not Viewed as an Issue in Most People’s Work Lives Even Though Nearly Half of Older Workers Report Physical Requirements in Their Jobs.ꜛ
A majority, 62 percent, of adults age 50 and older say their age is not or was not an issue in their work life and career. Seventeen percent say their age is or was an asset to their career, and 18 percent say their age is or was a liability. Occupation is a significant predictor of the views adults age 50 and older hold toward the influence of age on their career. Those who work or worked in professional services are most likely to consider their age an asset to their career (28 percent), outpacing the percentage who considered it an asset and who work or worked in sales or retail (13 percent), clerical professions (13 percent), construction (10 percent), manufacturing (3 percent), and farming or agriculture (4 percent). Adults age 50 years and older who work or worked in the technology industry are most likely to consider their age to be a liability to their career (42 percent), which is significantly higher than the percentages of those who work or worked in manufacturing (18 percent), management (17 percent), public services (17 percent), sales or retail (17 percent), clerical professions (13 percent), professional services (13 percent), and farming or agriculture (13 percent).
Americans age 50 and over who are working are not shying away from jobs that require physical exertion. Nearly half (44 percent) of adults age 50 years and older have a job that they say requires physical effort almost all or most of the time, and another 25 percent say their job requires physical effort some of the time. Three in ten say their job requires little to no physical effort. Adults age 50–54 (52 percent) and adults age 55–59 (55 percent) are more likely than adults age 60–64 (38 percent) and adults age 65 and older (39 percent) to have a job that requires or to have had a job that required physical effort almost all or most of the time.
Thirty-six percent of workers age 50 years and older admit that it has become more difficult to complete the physical requirements of their job as they age, while 52 percent say it is about the same as it was when they were younger and 10 percent it has become easier. Far more workers age 50 and older report that it has become easier to complete the mental requirements of their job. Eighteen percent of workers age 50 and older say it is much more or somewhat more difficult to complete the mental aspects of their job compared with when they were younger, 30 percent say it is much or somewhat easier, and 51 percent say it is about the same.
Few workers age 50 and older are scaling back the hours they work or seeking to reduce the physical or mental demands of their jobs. Twenty-two percent of workers age 50 years and older say they have cut back on their hours at work, 20 percent say they have tried to take on fewer physically demanding tasks at work, and 15 percent say they have tried to take on fewer mentally demanding tasks at work. Age is a significant predictor of the likelihood that a worker will reduce the hours he or she works as well as the likelihood that a worker will try to take on fewer mentally demanding tasks. Age does not significantly predict the likelihood that a worker will take on fewer physically demanding tasks.
Nearly half (48 percent) of workers age 50 years and older say their current boss is younger than they are, 18 percent say their current boss is older, and 27 percent say their current boss is about the same age. Nearly two-thirds (63 percent) say most of their co-workers are younger than they are, 4 percent say most of their co-workers are older, and 22 percent say their co-workers are about the same age. Seventy-six percent of workers age 50 years and older who say their current boss is younger than they are also say that most of their co-workers are younger as well.
People with bosses who are older than they are less likely to report that they have cut back on their hours than are people who have younger bosses (9 percent vs. 23 percent). Additionally, people who have an older boss are more likely than those with a younger boss to consider their age to be an asset to their career (39 percent vs. 20 percent). Finally, people with an older boss are more likely to report that they have experienced positive situations at work because of their age including having colleagues come to them more often for advice, feeling that they receive more respect within the company, and receiving desirable assignments.
One in Five Americans Reports Experiencing Age Discrimination in the Workplace or on the Job Market.ꜛ
Overall, 20 percent say that since turning 50 they have personally experienced prejudice or discrimination because of their age in the job market or at work. Rates are slightly higher for non-white individuals. Non-whites age 50 years and older are more likely than whites to say they have personally experienced prejudice or discrimination in the job market due to their age (28 percent to 17 percent).
People age 50 years and older were asked about several types of workplace discrimination they might have experienced since turning 50 years old, and 13 percent say they have been passed over for a raise, promotion, or chance to get ahead, 12 percent say they have been passed over for certain assignments, 12 percent say they have received certain unwanted assignments, 9 percent say they have been denied access to training or the opportunity to acquire new skills because of their age, and 8 percent say they have been laid off, fired, or forced to retire because of their age. Thirteen percent of people age 50 years and older say they have received or been exposed to unwelcome comments about their age in the workplace. Twenty-three percent say they have personally worried about their own ability to do their job as they age since turning 50 years old. Overall, 28 percent of respondents report that they have experienced at least one of these types of workplace discrimination.
Still, Americans 50 and over are far more likely to report positive outcomes because of their age. Sixty percent say they have had colleagues come to them for advice more often, and 42 percent say they have felt as though they were receiving more respect within the company since they turned 50.
Older Americans Express Frustration at Navigating the Job Market.ꜛ
Twenty-two percent of adults age 50 years and older have searched for a job in the last five years. This number varies considerably when race, age, income, job satisfaction, and attitudes toward retirement are taken into account. Of these adults age 50 years and older who have searched for a job in the last five years, 55 percent found the job search to be moderately or very difficult, 19 percent found the job search to be neither easy nor difficult, and 25 percent found the job search to be moderately or very easy.
- Forty-three percent of Hispanic adults age 50 years and older have searched for a job in the last five years, compared with 19 percent of white adults age 50 years and older, a difference of 24 percentage points.
- Adults age 50–54, 55–59, and 60–64 are more likely than are adults age 65 and older to have searched for a job in the last five years (33 percent vs. 29 percent vs. 26 percent vs. 10 percent).
- Twenty-nine percent of adults age 50 years and older with a household income of less than $50,000 have searched for a job in the last five years, compared with 17 percent of adults age 50 years and older with a household income of $50,000 to $100,000 and 20 percent with incomes over $100,000.
- Twenty-nine percent of adults age 50 years and older who feel more anxious than excited about their retirement have searched for a job in the last five years, compared with 16 percent of adults age 50 years and older who feel more excited than anxious about their retirement.
- Twenty-nine percent of adults age 50 years and older who feel mostly anxious about the amount of savings they have for retirement have searched for a job in the last five years, compared with 14 percent of adults age 50 years and older who feel mostly secure about the amount of savings they have for retirement.
- Working adults age 50 years and older who have experienced a decrease in pay in the last five years are significantly more likely than are adults who have experienced an increase in pay to have searched for a job in the last five years (42 percent to 21 percent).
- Forty four percent of adults 50 and over who report personally experiencing age discrimination at work or in the job market report that they have looked for a job in the last five years compared with 16 percent of those who have not experienced age discrimination.
The reasons for searching for a new job vary. Money drove many: 40 percent of adults age 50 and older who have searched for a job at some point in the last five years cite a need for extra income as the main reason for their job search. And 18 percent say they were laid off from a previous job. Other reasons are: wanting a better salary (7 percent), wanting to get out of the house (6 percent), wanting to acquire or improve benefits (4 percent), wanting to change career paths (4 percent), and being unhappy at their current jobs (3 percent).
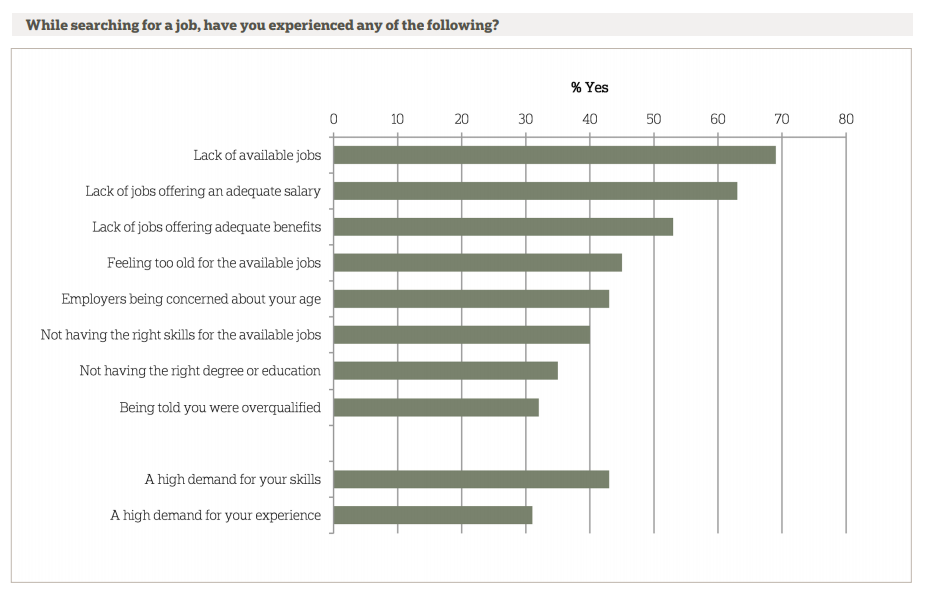
Adults age 50 years and older have had a variety of experiences, both positive and negative, while navigating the job market. Forty-three percent of adults age 50 years and older who have searched for a job in the last five years say they have experienced a high demand for their skills, and 31 percent have encountered a high demand for their experience. On the other hand, 69 percent of adults age 50 years and older who have searched for a job in the last five years say they have experienced a lack of available jobs, 63 percent had trouble finding jobs offering an adequate salary, and 53 percent there were not enough jobs offering adequate benefits. Forty-five percent have experienced feeling too old for the available jobs, 43 percent have encountered employers being concerned about their age, and 32 percent were told they were overqualified. Finally, 40 percent of adults age 50 years and older who have searched for a job in the last five years say they have not had the right skills for the available jobs, and 35 percent say they lacked the right degree or education.
Americans Revise Their Expectations About Retirement Timing as They Age.ꜛ
For many Americans age 50 and older, expectations about the age at which they will retire have changed over time. Nearly half, 47 percent, of working adults age 50 have shifted their anticipated retirement age from their expectations at 40 years old. Of those who are currently working, 17 percent are already working beyond the age at which they expected to retire when they were 40 years old.
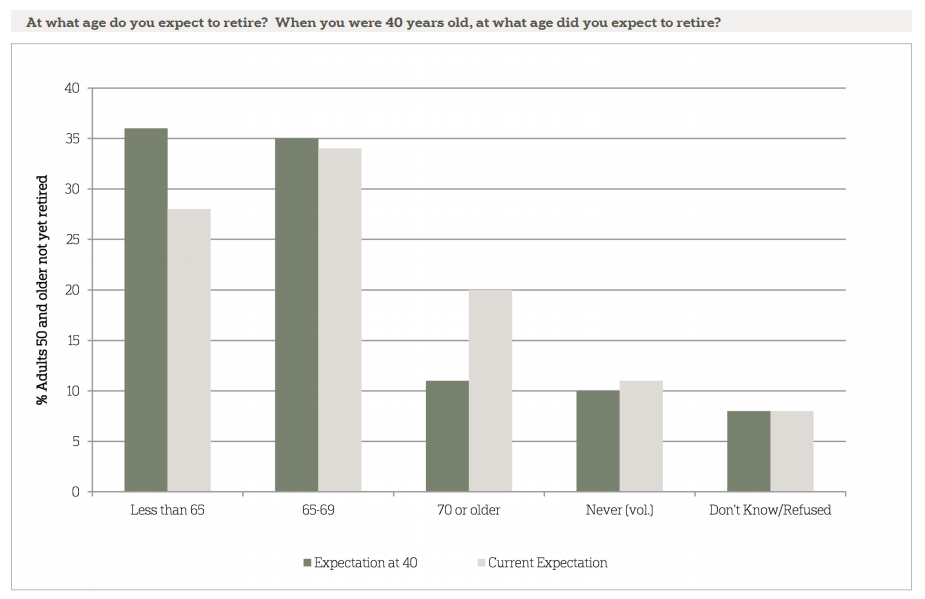
Americans age 50 and up who are not already retired report that when they think back to their plans at age 40, they expected to retire at an average age of 63. Nearly equivalent percentages of Americans report that at age 40, they expected to retire younger than age 65 (36 percent) or between age 65 and age 69 (35 percent). Eleven percent say they expected to retire at age 70 or older, and one in ten says that they never planned to retire. Many of these individuals who are not yet retired have shifted their plans toward later retirement. The percentage saying they expect to retire at age 70 or later has grown to 20 percent, while fewer than three in ten now say they plan to retire before age 65. Thirty-four percent say they will retire between age 65 and age 69, and 11 percent say they plan to never retire.
Most Americans Age 50 and Older Are Thinking About Their Retirement Years, but Significant Minorities Are Anxious.ꜛ
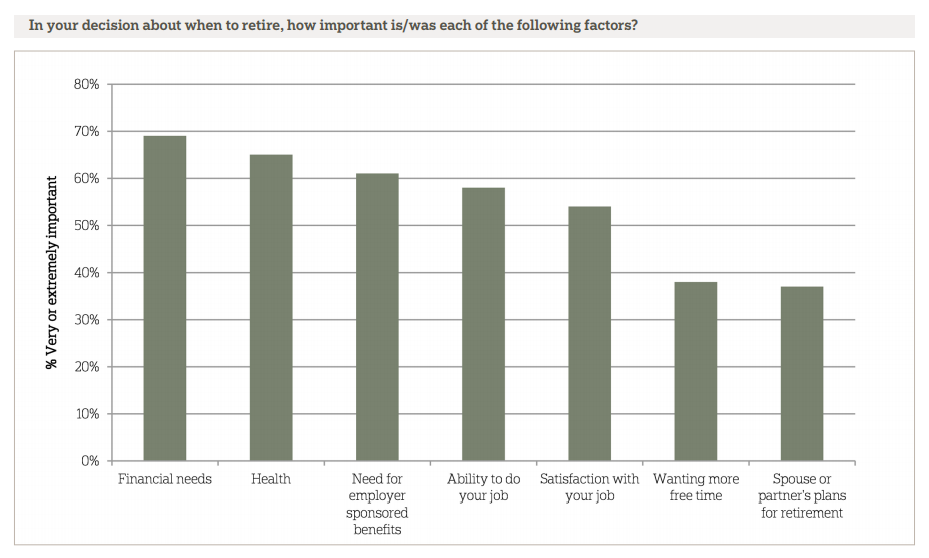
Approximately three-quarters (74 percent) of Americans age 50 and older state that they have given their retirement years some or a great deal of thought. Financial need is the most commonly cited factor in deciding when to retire (69 percent). Majorities also cite their health (65 percent), the need for benefits through an employer such as health insurance (61 percent), ability to do the job (58 percent), and job satisfaction (54 percent) as extremely or very important factors in their decision. Wanting more free time and the retirement plans of spouses and partners are viewed as less important factors (with 38 and 37 percent respectively designated as very or extremely important).
Overall, people in this age group are evenly split in terms of their excitement and anxiety about retirement. Forty-three percent report that, in general, they are more excited than anxious about their retirement. Thirty-eight percent report being more anxious, 15 percent volunteered that they feel neither, and 2 percent volunteered that they feel both excited and anxious.
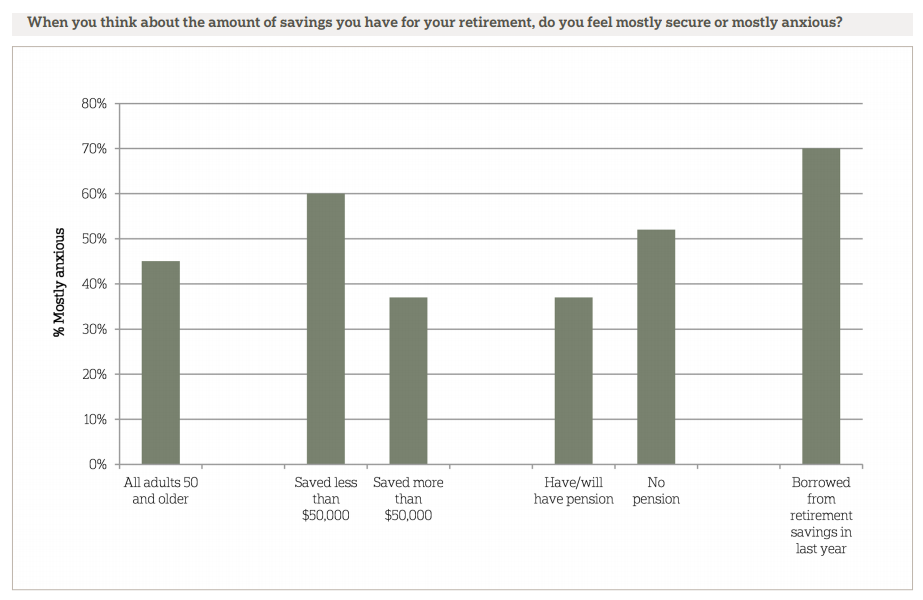
When asked specifically about retirement savings, about an equal share of people 50 and older feel secure about the amount of savings they have for retirement as feel anxious (46 percent vs. 45 percent). Perhaps surprisingly, these feelings are not related to whether they are saving money in addition to Social Security for retirement. Working people who are saving additional money for retirement are no more likely to feel secure than anxious when thinking about the amount of savings they have for retirement. At the same time, working people who are currently saving additional money for retirement are no more likely to feel secure than are those who are not saving additional money.
While the mere presence of some additional savings might not impact the likelihood of feelings of security versus anxiety about retirement savings generally, the amount of additional money saved does. People ages 50 and up with less than $50,000 saved are significantly more likely to feel anxious about their retirement savings (60 percent) than to feel secure (27 percent). Perhaps by the same token, those who have saved over $50,000 are significantly more likely to feel secure (58 percent) than to feel anxious (37 percent). The promise of a pension also reduces people’s feelings of anxiety, because people with pensions are more likely to feel secure than are those without them (58 percent vs. 36 percent). People without pensions are much more likely to feel anxious than are those with pensions (52 percent vs. 37 percent).
Just 12 percent of people 50 or older who do not consider themselves retired had to borrow money from their retirement plan in the past year, but those who did are much more likely to feel anxious (70 percent) than secure (12 percent).
Many Americans Are Saving for Retirement, Though Many Lack Significant Savings Outside Social Security and Pensions.ꜛ
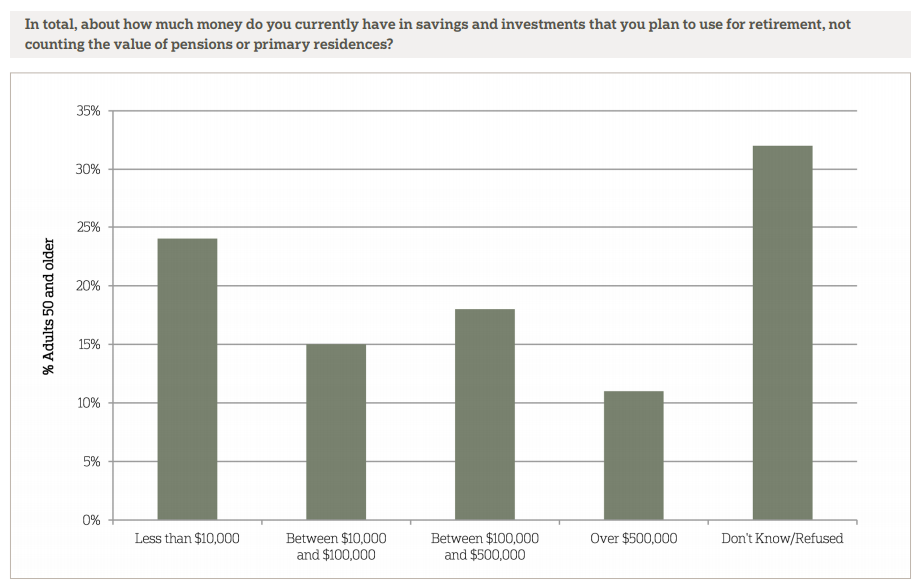
Few Americans are relying exclusively on Social Security benefits to keep them afloat during retirement. Among working people ages 50 and older, 75 percent say that they are currently saving additional money for retirement. But based on those who are willing to disclose how much they’ve saved, they have not made much progress. Expert opinions compiled by the U.S. Department of Labor note that the average American is in retirement for 20 years and should plan to need at least 70 percent of their working annual income to maintain their standard of living in retirement.6 Thirty-nine percent of all people ages 50 and older report having less than $100,000 tucked away for retirement, not including pensions or the value of primary residences. About a quarter, 24 percent, have less than $10,000 in retirement savings and investments. Eighteen percent of Americans 50 and older have between $100,000 and $500,000, 11 percent have more than $500,000, and 32 percent are unable or unwilling to provide their total savings. Among those respondents unwilling to provide their savings, 55 percent report feeling mostly secure about their retirement savings compared with 35 percent who report feeling mostly anxious.
Saving to supplement Social Security is closely related to demographic and socioeconomic factors. Working adults ages 50 or older with higher annual incomes are more likely to be saving additional money for retirement than are those with lower incomes. Eighty percent of those earning between $50,000 and $100,000 and 90 percent of those earning $100,000 or more say they are currently putting away additional money for retirement. Just 57 percent of people earning less than $50,000 a year say they are doing the same.
An important question facing people as they advance toward retirement is when to begin collecting Social Security benefits and how to use those benefits in concert with other retirement savings and investments. On average, people plan to start collecting or did start collecting Social Security benefits at age 63. Four in ten Americans say they will collect benefits before they turn 65, 43 percent will start collecting between 65 and 69 years old, and 6 percent say they will wait until they are 70 or older. Among those who already collect Social Security benefits, the average age they started collecting benefits was 65. Among those who do not yet receive benefits, the median age they expect to start collecting is 61—a year younger than most people are eligible according to the current Social Security eligibility criteria.
Similarly, people have used or plan to use savings beginning at age 65, on average. Eighty percent of people who do not yet collect Social Security benefits expect to start before dipping into their personal retirement savings. Fourteen percent expect to start collecting Social Security at the same age as they start using their own retirement savings, while 6 percent plan to start using retirement savings first. In comparison, of those who already collect Social Security, 35 percent started collecting Social Security before dipping into savings. Thirty-six percent said they started using Social Security at the same age as their savings, and 28 percent started using savings before collecting Social Security benefits.
Fewer than half (45 percent) of Americans 50 and up at present say they will or already do receive a pension. There is a generational divide between those who will or do receive a pension and those who do not and will not: 63 percent of people ages 50 to 54 say they do not have a pension in their future, while about half of people ages 60 or above have one. Higher educational attainment also corresponds with greater likelihood of receiving a pension. Fifty-six percent of college graduates ages 50 or older will or already do receive a pension. This rate falls to 42 percent for people with a high school degree, a technical school degree, or some college and plummets to just 25 percent for those with less than a high school degree.
Americans 50 and Older Generally Agree with the Status Quo Social Security Eligibility Age, and a Majority Opposes Raising the Eligibility Age.ꜛ
On average, Americans 50 and older believe that people should become eligible to receive full Social Security benefits at age 64. A majority (54 percent) of Americans 50 or older feel that people should be eligible for full Social Security benefits between the ages of 65 and 69 years old. Thirty-four percent feel full eligibility should come before the age of 65, while just 7 percent say people should have to wait until they are 70 or older to receive full benefits. There are no significant differences in opinions by party affiliation.
Education level is a significant predictor of opinions on when people should be eligible for full Social Security benefits. Those with less than a high school degree are most likely to think eligibility should kick in before turning 65 (50 percent), compared with just 37 percent who say eligibility for full benefits should start between the ages of 65 and 69 and 7 percent at age 70 or older. Those with at least a college degree, by contrast, are most likely to say people should start receiving full retirement benefits between ages 65 and 69 (66 percent) while just 19 percent say eligibility should start before age 65.
Looking at income levels, similar patterns stand out. Forty-four percent of those earning less than $50,000 per year say eligibility for full benefits should start before age 65. Just 29 percent of those earning between $50,000 and $100,000 and 23 percent of those making $100,000 or more agree. Those earning $100,000 or more annually are more likely than those earning less than $50,000 to say full eligibility should begin between ages 65 and 69 (61 percent vs. 47 percent) or at age 70 or above (13 percent vs. 5 percent).
Asked to assess a series of policies aimed at securing Social Security’s financial situation, Americans ages 50 and older prefer an approach that relies on increasing the money coming in to the system rather than decreasing benefits. Sixty-one percent favor raising the cap on income subject to Social Security taxes so that those with higher incomes pay taxes on more of their wages. Significant differences emerge along party and ideological lines. Democrats are most likely to support this policy (73 percent in favor), followed by Independents (61 percent) and Republicans (just 45 percent). More than seven out of ten liberals and moderates favor raising the cap subject to Social Security taxes. Fewer than five out of ten conservatives favor the policy and three out of ten oppose it. Additionally, seven out of ten college graduates 50 and up favor raising the cap on income subject to Social Security tax. That number falls as educational attainment decreases; six out of ten people 50 and up with a high school degree, technical school degree or some college favor raising the cap, and just five out of ten of those with less than a high school degree feel the same. Much of this pattern comes from significant differences among those who strongly favor this policy; there is no significant difference among those who moderately favor this policy based on education level.
Forty-one percent of adults 50 and over favor reducing Social Security benefits for senior with higher incomes; however, there are some differences by party and ideology. Forty-five percent of Democrats but just 35 percent of Republicans moderately or strongly favor reducing Social Security benefits for seniors with higher incomes. Liberals (51 percent) and moderates (46 percent) are also more likely to favor this policy than conservatives (34 percent).
Twenty-nine percent favor gradually raising the age at which people can begin receiving benefits. Although most are opposed to this policy, opposition is strongest among those under 65. Majorities of people ages 50–54 (62 percent), ages 55–59 (72 percent), and ages 60–64 (60 percent) oppose raising the age at which people can begin receiving Social Security benefits, while fewer than half (49 percent) of those ages 65 or older oppose this policy
Finally, twenty-one percent favor changing the way Social Security benefits are calculated so that annual cost of living raises are smaller. Opposition to this policy, at 62 percent overall, is fairly equal across partisan and demographic characteristics.
Few Americans Age 50 and Older See Themselves as “Old.”ꜛ
Americans who have reached or are nearing the traditional retirement age generally do not think of themselves as “old.” Overall, the majority of Americans age 50 and older have a positive outlook about their own ages. Six in ten report they feel younger than their age, a third feel about their age, and only 6 percent feel older. This is relatively consistent regardless of actual age, but it varies with income. Sixty-nine percent of those with incomes of $50,000 per year or more feel younger than their age, while only 53 percent of those earning lower amounts say the same.
On average, adults 50 and older think a person becomes old at 71.5 years. However, perceptions of when the average person becomes old are related to one’s own age and gender. The percentage of Americans who say the average person becomes old at age 70 or younger is 37 percent for those currently age 50–54, 32 percent for those age 55–59, 24 percent for those age 60–64, and only 15 percent for those age 65 and older. Men are more likely to give estimates of 70 or younger for when the average person becomes old than women (34 percent vs. 17 percent).
Study Methodologyꜛ
This survey was conducted by the Associated Press-NORC Center for Public Affairs Research from August 8–September 10, 2013. The survey was funded by The Alfred P. Sloan Foundation. NORC at the University of Chicago, and The Associated Press (AP) staff collaborated on all aspects of the study. Cognitive testing was performed on a draft version of the questionnaire instrument to ensure understandability and validity of survey questions. The authors thank Rebecca Reimer, Emily Alvarez, Dennis Junius, and Daniel Malato for their assistance in the analysis and writing of the report.
This random-digit-dial (RDD) survey of the 50 states and the District of Columbia was conducted via telephone with 1,024 Americans ages 50 and older. In households with more than one adult 50 years old or older, we used a process that randomly selected which eligible adult would be interviewed.
Interviews were conducted with 815 respondents on landlines and 209 respondents on cell phones. Cell phone respondents were offered a small monetary incentive for participating, as compensation for telephone usage charges. Interviews were conducted in both English and Spanish, depending on respondent preference. All interviews were completed by professional interviewers who were carefully trained on the specific survey for this study.
The final response rate was 21 percent, based on the Council of American Survey Research Organizations (CASRO) method. Under this method, our response rate is calculated as the product of the resolution rate (69 percent), the screener rate (82 percent), and the interview completion rate (37 percent). The overall margin of error was +/- 4.1 percentage points.
The RDD sample was provided by a third-party vendor, Marketing Systems Group. The sampling frame utilizes the standard dual telephone frames (landline and cell). Sampling weights were calculated to adjust for unequal selection probabilities within the household and multiplicity of telephone lines. We adjusted for nonresponse bias arising from differential response rates and noncoverage bias across various demographic groups through post-stratification. Post-stratification variables included age, sex, race, region, and education using the 2011 American Community Survey released September 2012; employment status using the 2012 Current Population Survey; and patterns of landline and cell phone use from the 2012 National Health Interview Survey. The weighted data, which thus reflect the U.S. population of adults ages 50 and older, were used for all analyses.
All analyses were conducted using STATA (version 13), which allows for adjustment of standard errors for complex sample designs. All differences reported between subgroups of the U.S. population are at the 95 percent level of statistical significance, meaning that there is only a 5 percent (or less) probability that the observed differences could be attributed to chance variation in sampling. Additionally, bivariate differences between subgroups are only reported when they also remain robust in a multivariate model controlling for other demographic, political, and socioeconomic covariates. A comprehensive listing of all study questions, complete with tabulations of top-level results for each question, is available on the AP-NORC Center for Public Affairs Research website: www.apnorc.org.
About The Associated Press-NORC Center for Public Affairs Research
The AP-NORC Center for Public Affairs Research taps into the power of social science research and the highest-quality journalism to bring key information to people across the nation and throughout the world.
- The Associated Press is the world’s essential news organization, bringing fast, unbiased news to all media platforms and formats.
- NORC at the University of Chicago is one of the oldest and most respected independent research institutions in the world.
The two organizations have established the Associated Press-NORC Center for Public Affairs Research to conduct, analyze, and distribute social science research in the public interest on newsworthy topics and to use the power of journalism to tell the stories that the research reveals.
The founding principles of the AP-NORC Center include a mandate to carefully preserve and protect the scientific integrity and objectivity of NORC and the journalistic independence of The Associated Press. All work conducted by the Center conforms to the highest levels of scientific integrity to prevent any real or perceived bias in the research. All of the work of the Center is subject to review by its advisory committee to help ensure it meets these standards. The Center will publicize the results of all studies and make all datasets and study documentation available to scholars and the public.
About the Authors
Jennifer Benz, Senior Research Scientist, The Associated Press-NORC Center for Public Affairs Research
Matt Sedensky, Journalism Fellow, The Associated Press-NORC Center for Public Affairs Research
Trevor Tompson, Director, The Associated Press-NORC Center for Public Affairs Research
Jennifer Agiesta, Director of Polling, The Associated Press
Footnotesꜛ
1. Administration on Aging. 2011. Supporting data for the Profile of Older Adults. http://www.aoa.gov/aoaroot/aging_statistics/Profile/2011/docs/2011profile.xls, accessed October 8, 2013.ꜛ
2. http://www.bls.gov/opub/mlr/2012/01/art3full.pdf.ꜛ
3. Fries, J. 1980. Aging, Natural Death and the Compression of Morbidity.” NEJM 303: 130-35.ꜛ
4. Kulish, M., K. Smith and C. Kent. 2006. Ageing, Retirement and Savings: A General Equilibrium Analysis. Reserve Bank of Australia Research (Discussion Paper 2006-06).ꜛ
5. Shoven, J and S. Slavov. 2012. The Decision to Delay Social Security Benefits: Theory and Evidence. NBER Working Paper No. 17866.ꜛ
6. United States Department of Labor. Top 10 Ways to Prepare for Retirement. http://www.dol.gov/ebsa/publications/10_ways_to_prepare.html, accessed October 8, 2013.ꜛ